



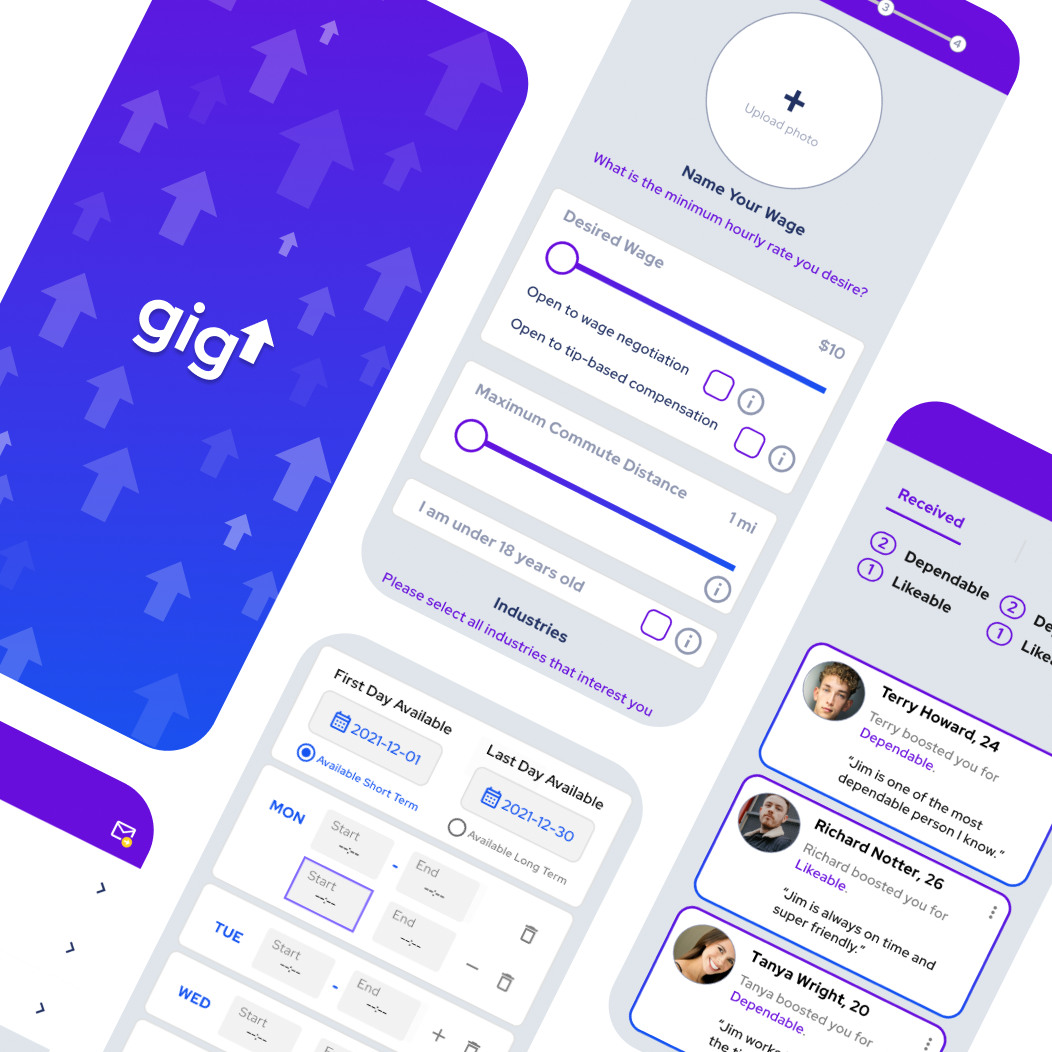
A mobile application for job-seekers to be matched with part-time positions through criteria that they set, and a web portal for employers to view job listings and potential candidates for hire. Also includes a super-admin portal for access to both applications and all data.
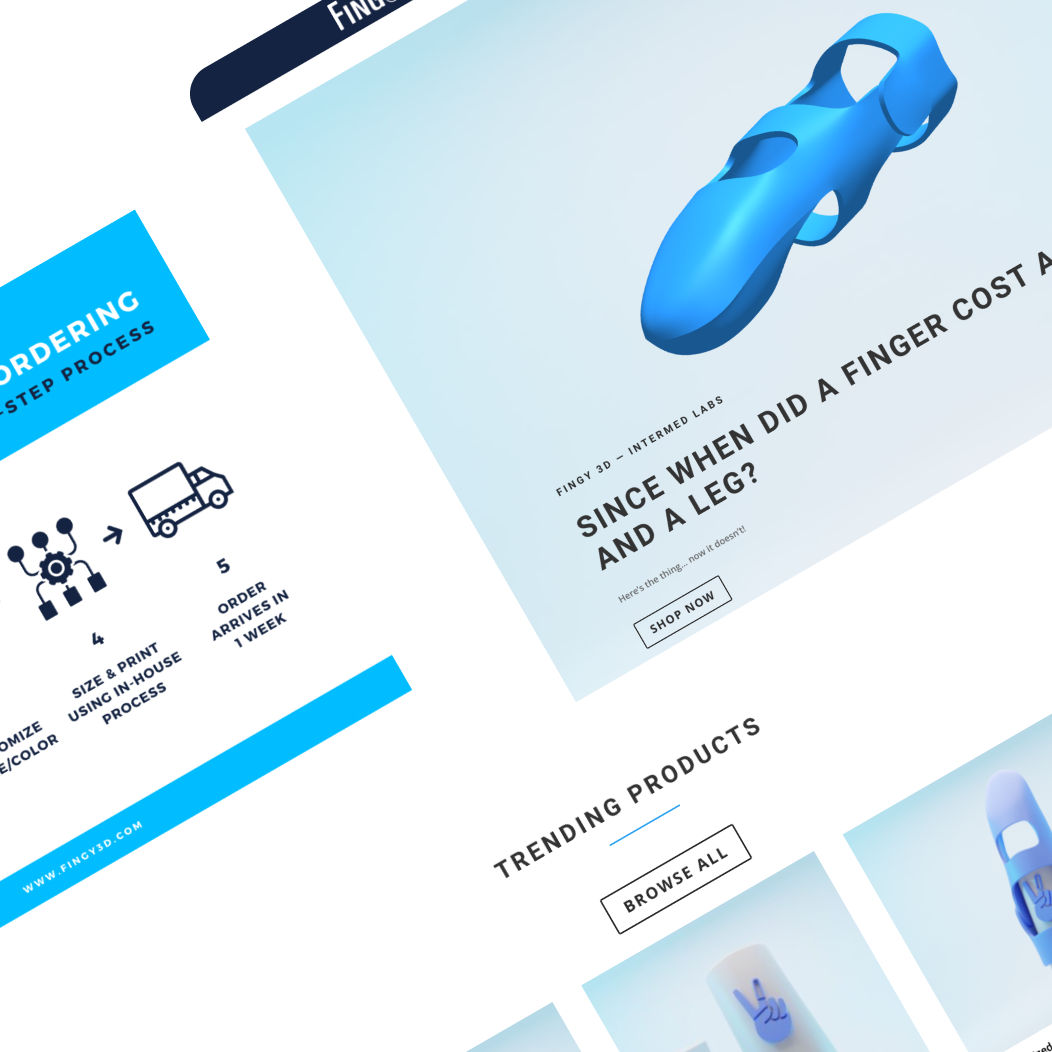
Fingy3D aims to bring accessible and affordable finger prosthetics to everyone using 3D printing and a custom-built hand scanner. The hand scanner uses a piece of 8"x11" paper and your phone's camera to accurately measure your finger prosthetic sizing, which we can then use to custom print an affordable finger prosthetic.
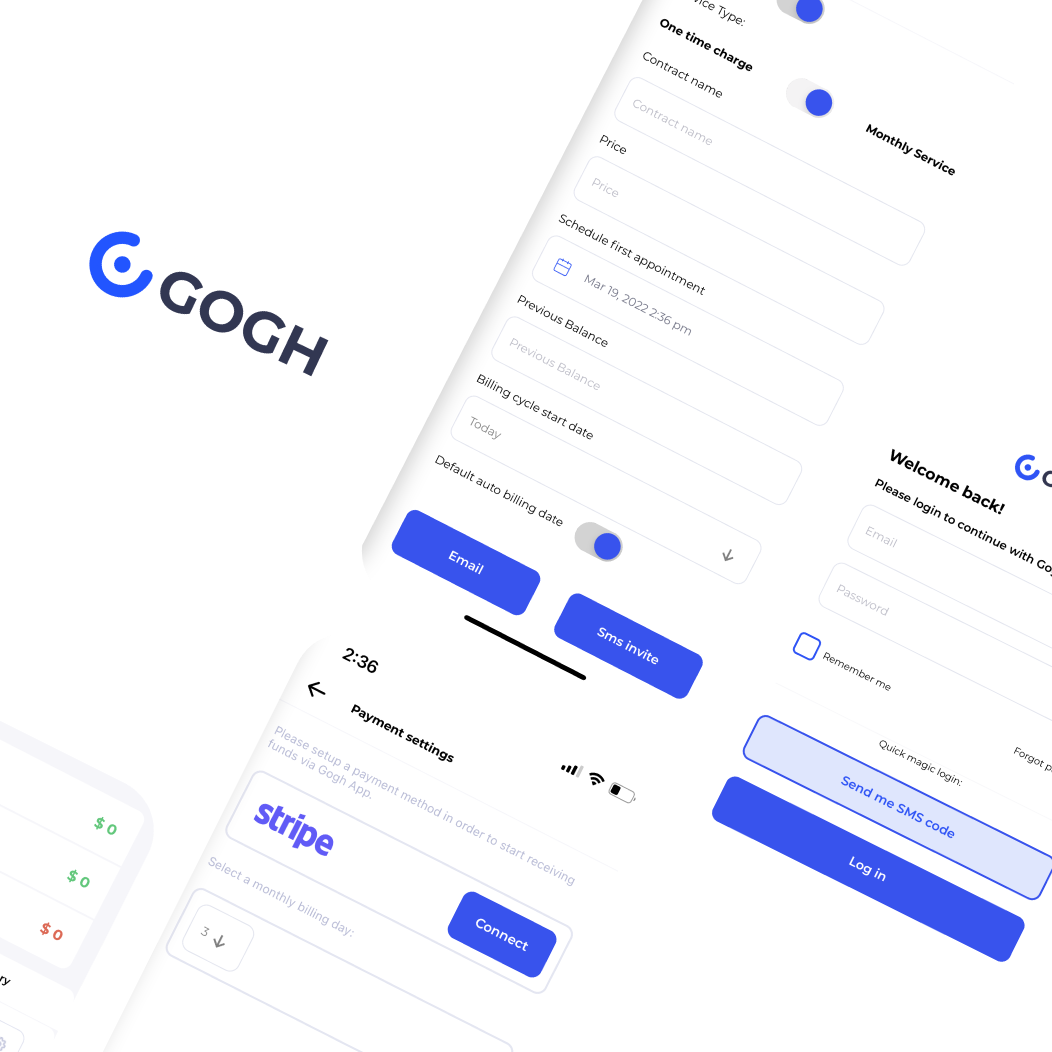
A payment reconciliation platform that allows service providers to effortlessly create service payment plans with their customers and allows customers to easily track their payment schedules. Includes a marketplace of services to browse through that fit a customer's budget and needs.
Contracted with the U.S. Air Force and on the Forbes 30/30 list, Iconic Air pioneers a new way of emissions monitoring and data reporting for the oil and gas industry. Runs on many custom built sensor components and uses Chart.js to help platform users visualize their data in the format of their liking.